The record
The claims, one by one
Bailey Freeman made his case twice: on MLB Network’s MLB Now and in the Foolish Baseball video “The Brewers Aren’t Built for October”. This page lists every major claim from both and what 4.6 million plate appearances say about each. Some of his premises are true, and this page says so; the argument fails where its evidence is noise, and that is most of it.
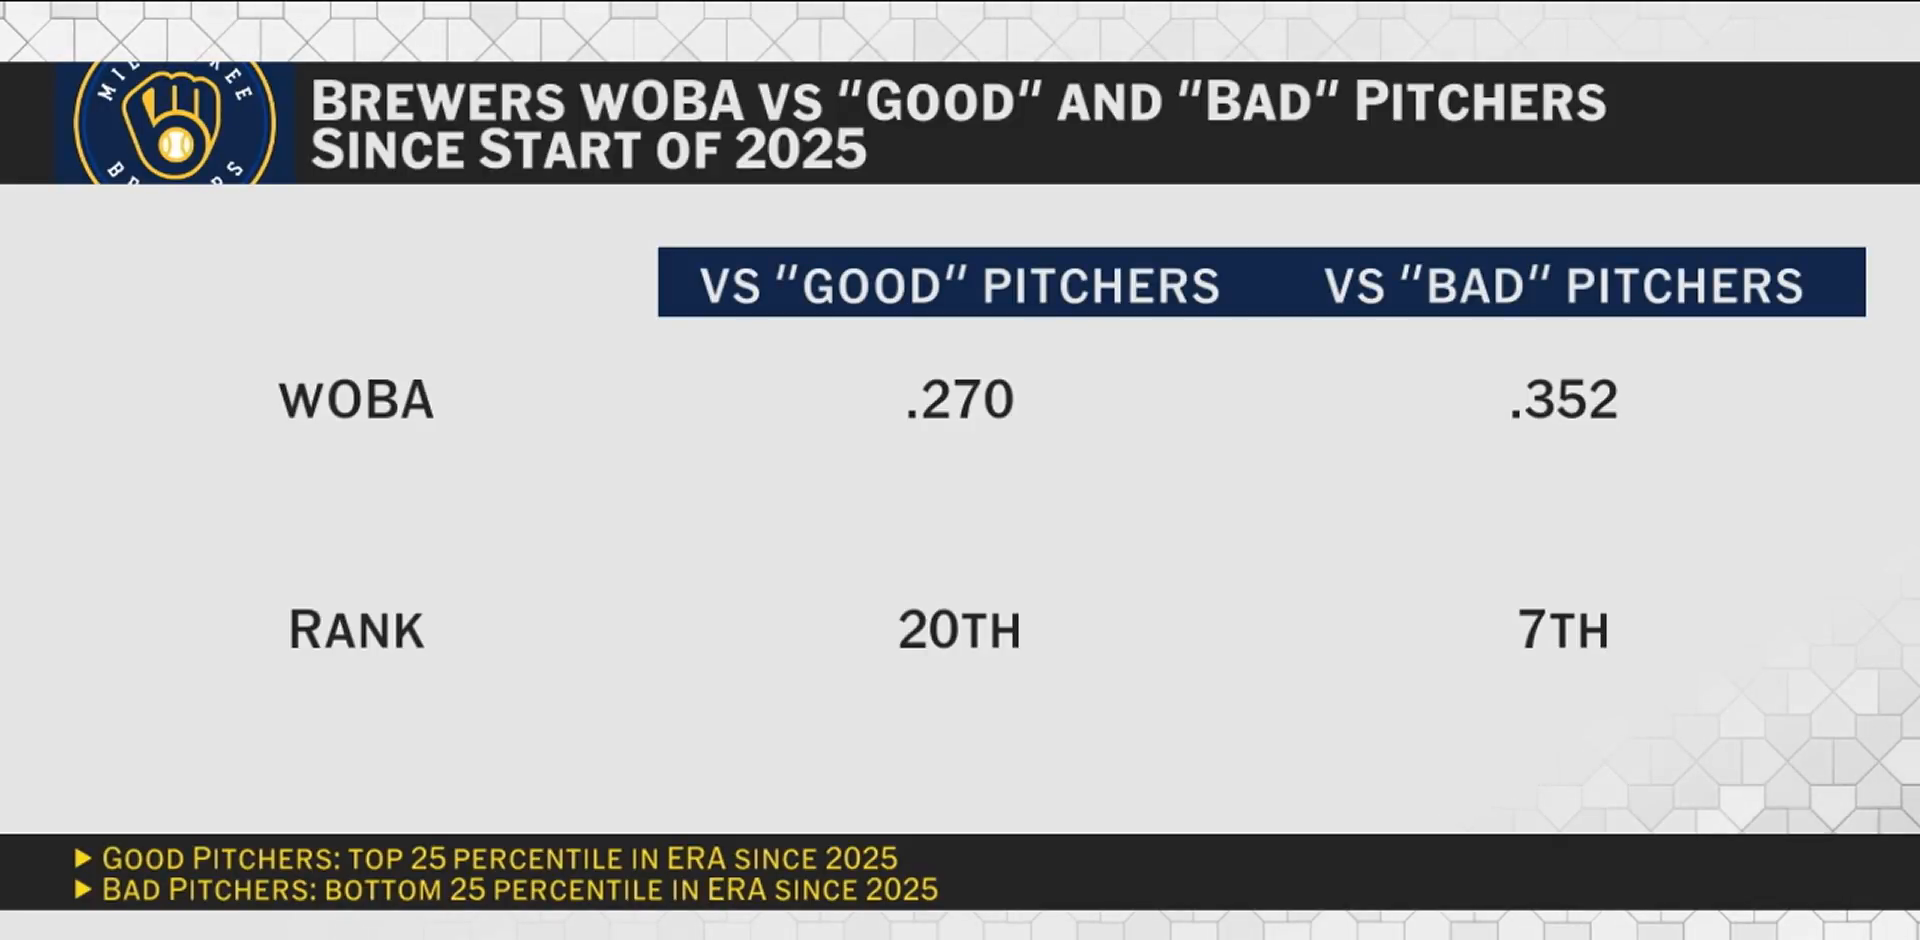
The Brewers hit bad pitching but not good pitching
Segment graphic: .270 (20th) vs good, .352 (7th) vs bad. Video: .270 (20th) vs good, .362 (2nd) vs bad, a 92-point gap.
Reproducing his exact specification (ERA quartiles, 120+ pooled innings, 2025-26) gives Milwaukee a 93-point gap. It then collapses in stages on the identical plate appearances: removing only the circularity cuts it to 50; fully ex-ante labels leave 23, which is about 1.8 standard deviations of two-season sampling noise, and rank Milwaukee second in baseball against good pitching. Under pre-season ZiPS buckets the split disappears entirely (8th and 8th).
ERA quartiles pooled 2025-26, exactly as the video defines them
same pitchers, same season; each pitcher rated without Milwaukee's plate appearances
pitchers rated by projection before the plate appearances happened
Milwaukee’s good-vs-bad wOBA gap in points, on one fixed set of 181,660 plate appearances against the 207 qualifying pitchers. Only the labels change between bars.
The two tellings also disagree with each other: 7th vs bad on air, 2nd in the video, five ranking places apart under one analyst’s one method. Rebuild any version yourself on the dashboard.
The drop-off is the largest in baseball
Video: a 92-point wOBA drop-off and an 18-spot rank differential, both described as the league's largest.
Someone must rank first in any statistic. This one is ~93% luck by variance decomposition, its rankings move about five places (of 30) when the bucket definition changes, and in our data window Milwaukee’s gap is not even the largest (Baltimore’s is, at 105 points). A superlative drawn from a noise distribution describes the draw, and describes the team only faintly.
The Brewers are the most patient team in baseball
Segment and video: lowest swing rate in the league since 2025 (44%); they wear down pitchers with poor command or ordinary stuff.
True, and it is a real trait. We measure their 2025-26 swing rate at 44.5%, the lowest of the thirty teams, and team swing rate has split-half reliability of +0.91: teams that swing rarely in odd-numbered dates swing rarely in even-numbered dates. Freeman’s description of how this offense works is accurate.
They struggle against 98+ mph, and passivity is why
Video: .272 wOBA (19th) against fastballs 98+ mph vs .357 (7th) against 97 and below; 3rd in chase-zone run value but 19th in the heart of the zone.
The numbers approximately reproduce: we get .282 (18th) against 98+ and .335 (4th) against everything slower, with small differences from cutoff dates and band definitions. But the evidence and the hypothesis need separating. The vs-98+ differential as a team statistic has split-half reliability of −0.01: it is noise of the same species as the good/bad split, and it cannot carry the argument. The underlying hypothesis, that a passive profile fails specifically against elite velocity and command, rests on stable traits and remains genuinely open. It is the subject of the planned mechanism study, and the pre-registered October test bears on it directly.
Split-half reliability: the same statistic measured on odd and even calendar dates of the same team-season, correlated across 330 team-seasons (2015-2025; the slope row uses all 780 since 2000). A statistic must agree with itself before it can describe a team.
October removes the bad pitching that feeds them
Video: about half of regular-season innings come from below-average arms; postseason staffs concentrate on top starters and elite relievers, raising average fastball velocity from 94.5 to 95.8 mph.
The premise is true and we can quantify it: postseason offense drops about 40 wOBA points league-wide, and 66% of that drop is explained by the pitchers actually faced. What fails is the inference that this hurts Milwaukee more than anyone else: the team-specific slope it would operate through has zero reliability, and slopes add nothing to series prediction (likelihood-ratio p = 0.63 over 229 series). October removes bad pitching from everyone’s schedule. See the October page.
Home-run-light offenses do not scale to October
Video: 46% of playoff runs score via home run against 41% in the regular season, and the Brewers are 30th at 32%.
The premise replicates over 26 postseasons: the league’s home-run share of runs rises from 37.9% to 41.7% in October. The conclusion does not: across 252 team-postseasons, home-run-light offenses show no opponent-adjusted underperformance (t ≈ 1.0), and the home-run-share difference adds nothing to series prediction (p = 0.79).
The matchup case studies: dominated by Webb and Ryan, feasting on Parker and Freeland
Video: 4 starts and 3 total runs against Logan Webb; 25 strikeouts to 5 walks against Joe Ryan; 15 runs in 8.2 innings off Mitchell Parker.
Every team hits worse against elite arms; that is the league-wide slope, and it is the most robustly replicated fact in this study. Four starts against one pitcher is a sample the reliability section prices exactly: a team-season of such splits retains about 12% of its face value, and a four-game slice retains far less. The same video could be cut for any contender by choosing which pitchers to remember.
Jackson Chourio is the exception that proves the profile
Video: Chourio's aggressive approach attacks quality stuff, with an OPS over 1.000 in October.
The batter-level version of the model estimates the true-talent variance of individual hitters’ slopes on pitcher quality at exactly zero, with tight intervals from roughly 40,000 batter-seasons. An OPS over a handful of October games is the least reliable statistic discussed anywhere on this site. Chourio may become a great October hitter; nothing measurable yet separates his slope from anyone else’s.
The Brewers aren't built for October
Both artifacts: the core thesis, argued from everything above.
Stated falsifiably, this thesis predicts that Milwaukee will underperform its opponent-adjusted expectation this postseason. The statistics offered as evidence for it do not survive; the approach-based version of it remains open; and rather than argue, we froze the test before the playoffs. Milwaukee’s frozen 2026 slope is +0.14, mildly on the resists-good-pitching side of zero. The pre-registration states exactly what each hypothesis predicts, and the result will be reported either way.